Sales Data Analysis
This report aims to analyze and enhance sales performance through a comprehensive review of the sales dataset, utilizing the interactive Excel dashboard to identify trends, strengths, and areas for improvement in revenue generation across various dimensions such as time, location, and product categories.
Key Insights:
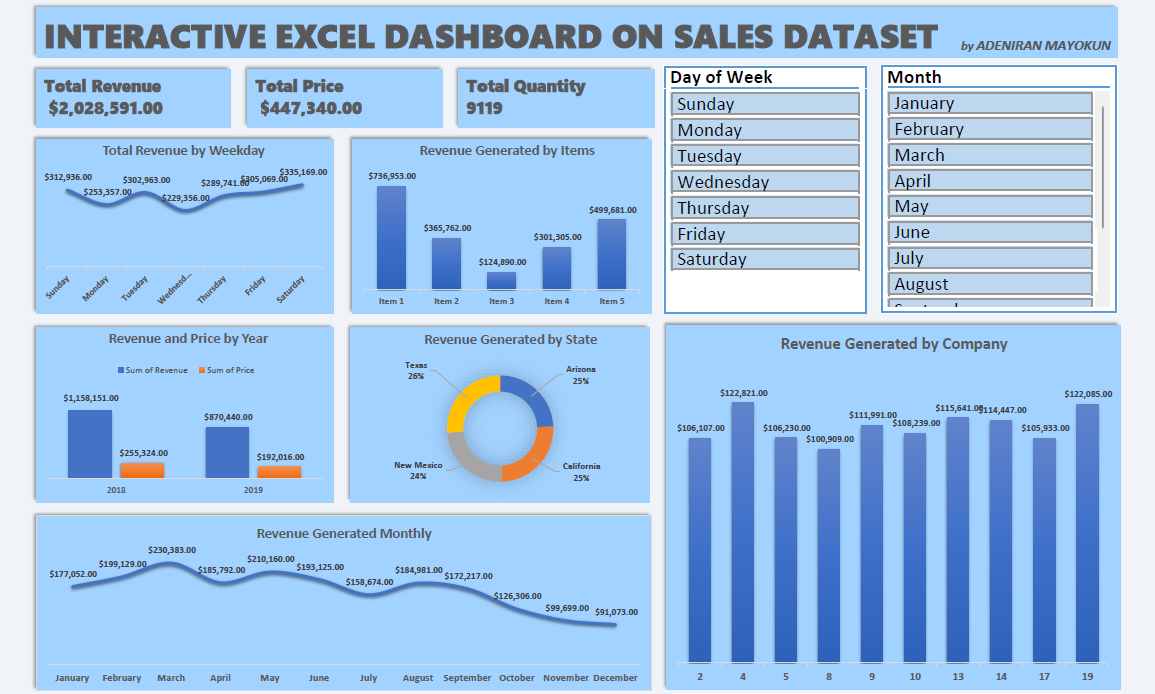
✪ The total revenue generated is $2,028,591.00, indicating a strong sales performance overall.
✪ The total quantity sold is 9,119 units, suggesting a healthy volume of transactions.
✪ The highest monthly revenue was recorded in January at $1,158,151.00, while revenues decreased significantly in February to $870,440.00. This indicates potential seasonality or external factors affecting sales.
✪ The yearly revenue shows slight fluctuations with $312,936.00 in 2018 and $302,963.00 in 2019, suggesting a need for strategies to boost revenue growth year-over-year.
✪ Revenue generation varies by weekday, with Mondays generating the most at $736,953.00. This may imply higher customer engagement or purchasing behavior at the start of the week.
✪ Revenue is fairly distributed among states, with Texas leading at 26%, followed by California and Arizona at 25% each. This indicates a balanced market presence across these regions.
Recommendations:
✪ Focus marketing efforts on the highest revenue-generating months and weekdays. For instance, increase promotions and advertisements leading up to January and on Mondays to capitalize on higher sales potential.
✪ Implement initiatives aimed at increasing yearly revenue by exploring new markets or expanding product offerings. Develop targeted campaigns to boost sales from 2018 to 2019 levels and beyond.
✪ Tailor marketing and sales strategies for states based on their revenue contributions. For instance, consider localized promotions in Texas, California, and Arizona to enhance engagement and sales.
To learn more about this project, click the view report button.